


This is the second in a series of articles praising some of the tools that I have found to be “Secret Weapons”—tools that have proven unreasonably and repeatedly effective throughout my career, and that I think are not as well known or appreciated as they should be.
Let us now praise Graphviz.
From the homepage:
Graphviz is open source graph visualization software. Graph visualization is a way of representing structural information as diagrams of abstract graphs and networks.
That’s all fine and good, but the (IMHO) important part comes later on the page:
The Graphviz layout programs take descriptions of graphs in a simple text language, and make diagrams in useful formats…
In other words, Graphviz lets you take a graph.dot text file that looks like this…
digraph G {
    start -> step_one -> end;
    start -> step_two -> end;
    step_one -> step_two;
}
…run a command like this (dot is one of the Graphviz suite of executables)…
dot graph.dot -Tpng > graphviz-example.png
…and produce this:
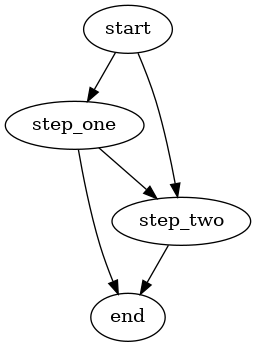
That’s a very simple example—Graphviz can do much, much more—but the heart of what makes Graphviz a secret weapon is already on display here: your graph is represented as text, which means it can be version-controlled, diffed, and programmatically generated with ease.
A few occasions on which Graphviz has saved my bacon / the bacon of the team I was on:
-
That time I was instrumenting inter-service calls among dozens of services, and wanted to be able to visualize them, including a shaded green to red arrow to display dependency health, and update that visualization on short (~15 minute) cycles.
-
That time we were trying to understand an ETL process call-graph, and just instrumented the orchestration process to spit out
${step_name_one} -> ${step_name_two};on transitions, collected those into a digraph like the one above, and presto! Visualization. -
That time we instrumented a forky, complex analytics pipeline to log its progress as lines in a
dotfile, which was then rendered and pushed to S3, where it could be refreshed to create a really nice operational dashboard. -
That time I was hacking together an architecture proposal with a couple other folks, and we were able to include the supporting diagrams as embedded text and employ standard pull requests to collaborate on it.
Graphviz is a supremely useful utility when you want to version graphical representations of flows, visualize steps in complex processes, or instrument call-graphs. Give it a try.